


2 min read
DevonWay’s new Miramar user interface promotes productivity, speeds adoption, and minimizes training. Below are some exciting new features in Miramar.
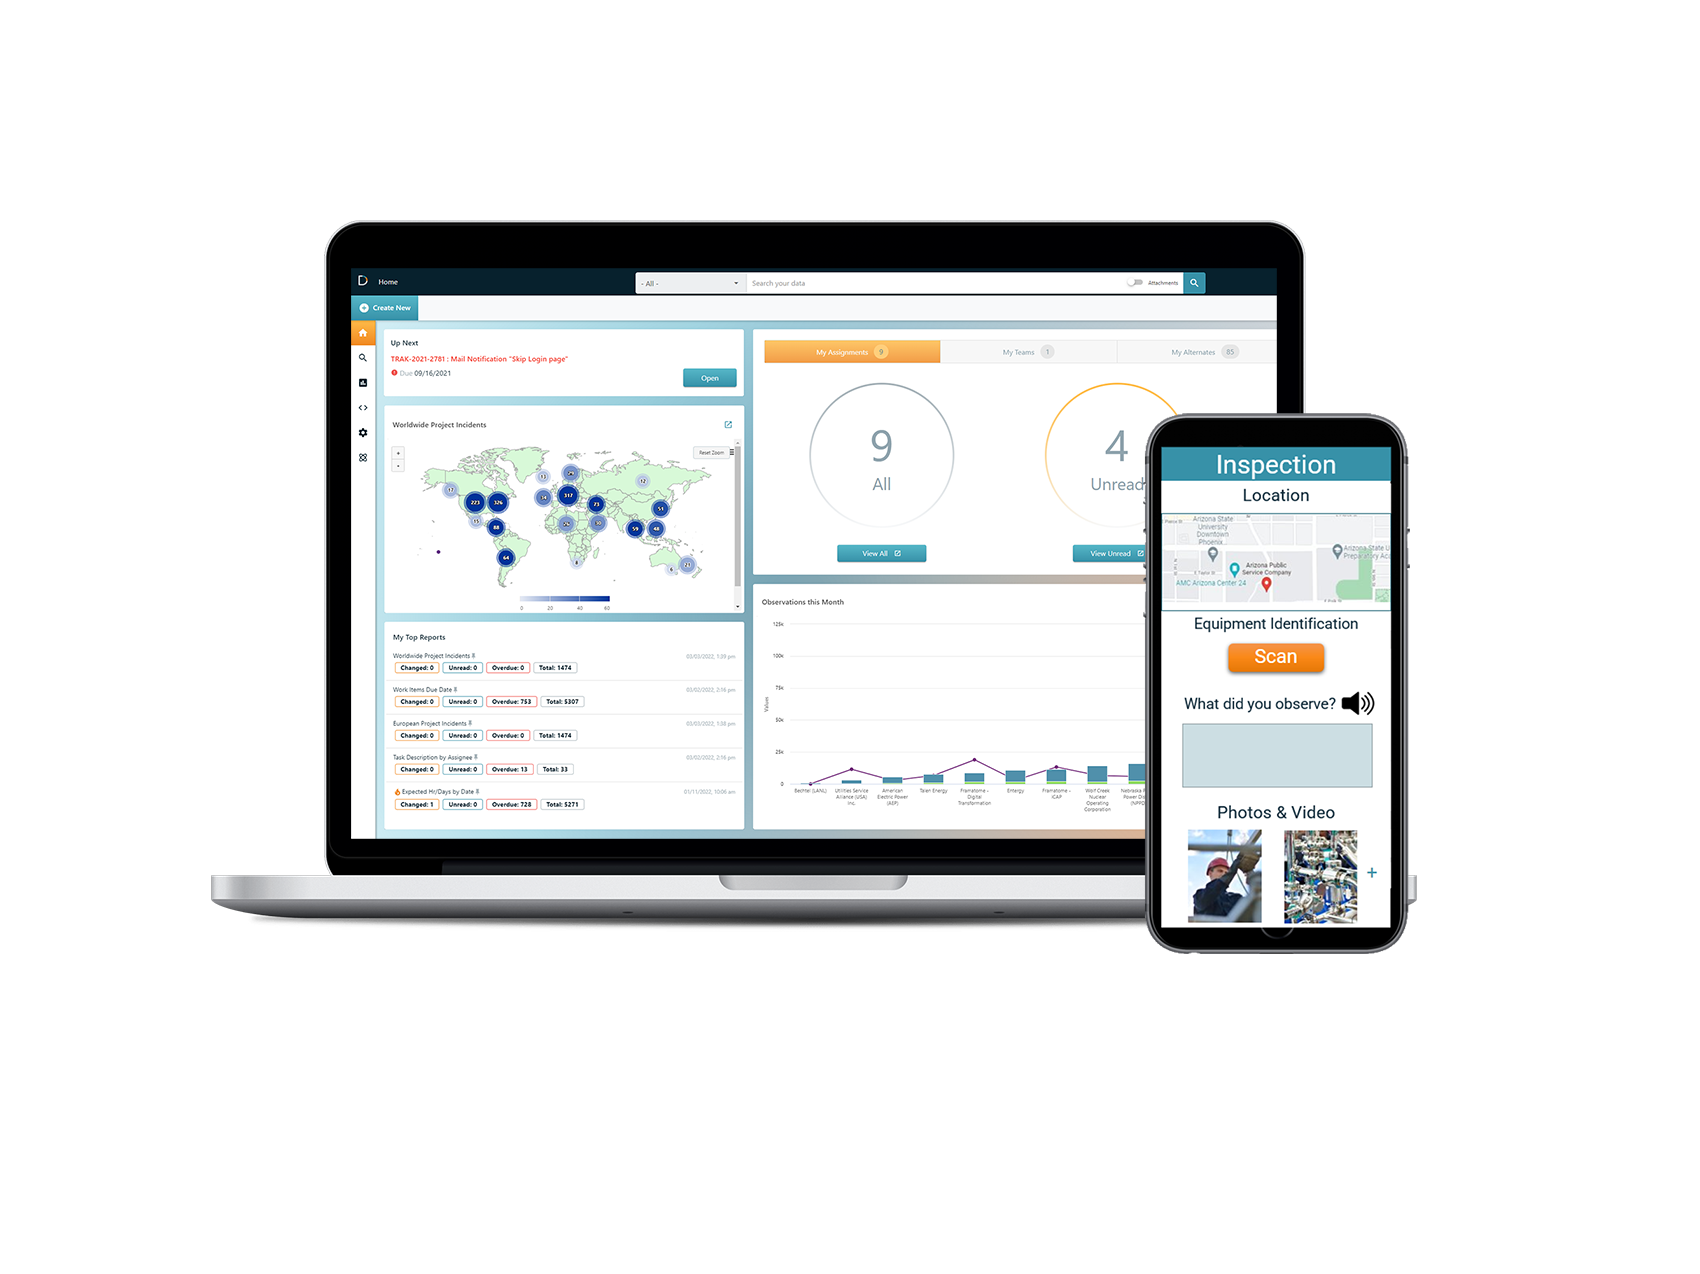
Productivity-boosting homepage
At a glance, you can create new items, find and follow up on your tasks, and see an overview of assignments – those assigned to you, your team, and your alternates. It’s clean, clear, and easy to navigate, with fast drill down and more.
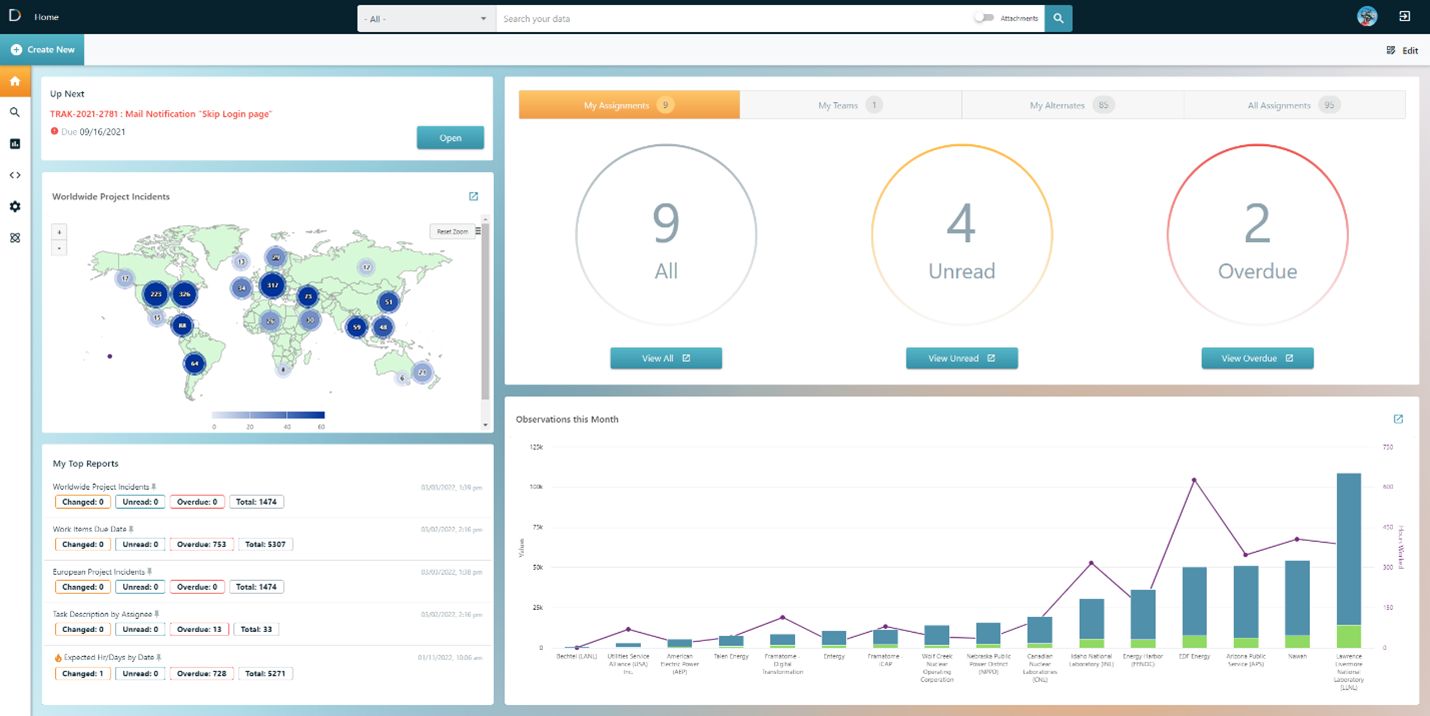
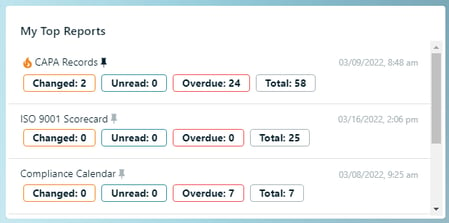
Make your homepage your very own by choosing what to display and how to display it. Pin the reports you look at most to My Top Reports – your homepage then shows you info about the data in each report, so you can easily see the number of records in the report that are Changed, Unread, Overdue, and the Total count. You’re alerted to report changes with a flame icon next to the report name.
Quick charts with one click
It’s made it faster and easier for anyone to create reports and charts with virtually zero training.
To clarify terms, a report is an output of collected and filtered data. A chart is a visual display of that data. Miramar includes multiple report types: List, Table, Card Summary, Calendar, and Chart. Chart types include Line, Bar, Column, Area, Trend, Geolocation/Map, and more coming soon.
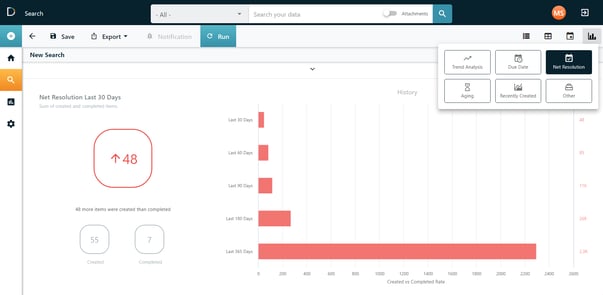
Pre-built charts are included and only require a single-click to create. Simply search to find your data items and select the pre-built chart you want. All Miramar charts include in-chart drilldown to quickly review the data behind the chart. Pre-built charts available now include:
- Due Date: a 60-day bar graph of what’s due and when. Chart colors show overdue items, items due in the next week and items due after 7 days.
- Aging: a special display for showing how long items have been open in the system that separates items into age groups (e.g., less than 30 days old, 30-60 days, etc.). Also shows due-date “buckets” within each age group to easily see due date status of items in each group.
- Net Resolution: a work backlog summary and burndown for the past 30 days, as shown below. For example, compare how many Corrective Actions are created versus how many are resolved. Compare the net resolution of items over 30, 60, 90, 180, and 365-day spans.
Clarity and context
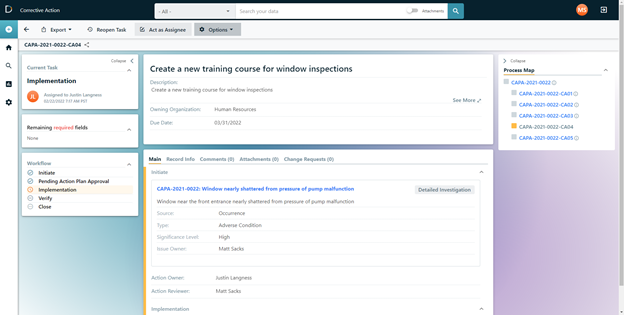
When you open an individual record, you can see its status, who it’s assigned to, and the workflow that it’s in. You can also see a list of remaining required fields that need your attention. The Process Map (right side in screenshot below) shows links to related processes and data, so you can click in for context without additional searching.
See Miramar in action
Sign up for a demo with one of our product experts to see these features live and in action.
Related Posts
New SEC Greenhouse Gas Reporting Rules Passed
On March 6, the U.S. Securities and Exchange Commission (SEC) adopted new rules for climate-related...
How to Take Your Control of Work Process to the Next Level
In high-risk industries, an organization’s safety management is critical to ensuring operations are...
What Is FedRAMP And Why To Use Certified Providers
Organizations have an obligation to keep their online information safe, and that includes selecting...