At DevonWay, our clients have seen more employee engagement, increased management visibility, and overall improved health and safety with Mobile Observations. What was once a rigid paper or spreadsheet-based process is now a flexible, digital, highly integrated solution that supports safety excellence. While everyone’s observation and inspection processes look a little different, we’ve provided a general framework to help you drive next level safety outcomes using Mobile Observations.
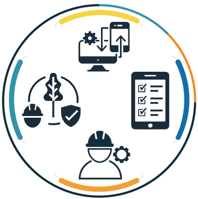
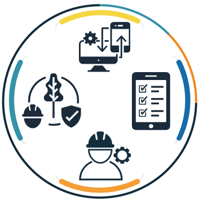
Mobile Observations Infographic
Observe
Capture observations in the field without requiring a network connection –the data syncs automatically once connection is restored. With features like voice-to-text, image attachment, and image markup, you have everything you need to easily and accurately capture the right data.
Route
Automatically route observations to the workflows that will get you actionable results, such as assessments, corrective actions, operating experiences, lessons learned, and more. This could mean integrating with other DevonWay QMS or EH&S solutions, or connecting to your existing processes.
Customize
Customize your own cards with required fields, behaviors/attributes, ratings, and more. Make them as simple or as complex as needed – all without involving IT or DevonWay support.
Trend
Create trending graphs by attribute, category, card, trend code, or any other structured data in your observations so that you’ll have both detailed and high-level views of the trends that are most important to you. These could be in the form of Pareto Charts, Statistical Process Control (SPC) charts or heat maps, depending on your preference.
Monitor
Get notified instantly of upcoming actions, adverse events, or other criteria using trigger-based notifications.
Improve
Use the data you collect to derive insights and adjust for continuous improvement.
To learn more or to request a demo, please contact us.